Guide · Dividends
Yield on cost vs dividend yield: which one to watch in your portfolio

Tortuga Trades · · 7 min
A stock you bought years ago now pays you 6% of what you paid for it. Is that a position yielding 6%? Not exactly, and the gap between those two sentences is the gap between yield on cost and dividend yield. Both are useful, but they answer different questions, and mixing them up leads you to hold on to a stock because of a number that looks backwards.
Same dividend, two divisors
Both measures start from the same numerator: one year of dividends. What changes is what you divide it by.
- Dividend yielddivides it by the stock's current price. It is the figure quote websites publish.
- Yield on cost divides it by what each share cost you: your average cost.
One thing is worth saying from the start: yield on cost has no official definition. It is a convention of the financial press, and the formula above is the usual one. So rather than arguing about which one is «correct», what matters is knowing what each one measures.
An example makes it clear. Suppose you bought 100 shares at €20, they trade at €40 today, and the company pays €1.20 per share a year.
In other words, yield on cost measures the dividend against your past; dividend yield, against the present. Neither changes what you collect: €120 a year either way.
Which question each one answers
Dividend yield answers this: if I put the money into this stock today, what share of it would come back each year as dividends? It lets you compare stocks with each other, or a stock with anywhere else you could keep that money, because they are all measured against the same moment: today.
Yield on cost answers something else: how much has the dividend grown relative to what I paid? It measures the history of your position. If the company has kept raising its dividend and you haven't sold, yield on cost shows it, and it is fair to look at it with some satisfaction.
The problem starts when the second figure is used to answer the first question.
Why yield on cost flatters old positions
Go back to the example. Your 100 shares are worth €4,000 today. If you sold them, you would have €4,000, not the €2,000 you paid. And that €4,000 is earning you €120 a year: 3%. That is what is called opportunity cost, and the honest question, when deciding whether to hold, is what that same money would earn somewhere else.
Put another way, your money is worth what it is worth today, not what it cost you. The 6% isn't false: it is what the stock pays relative to your cost. But it doesn't describe what the money you have in it right now is earning.
Three observations, so as not to overshoot in the other direction:
- Selling isn't free.There are commissions and, if the stock has risen, a taxable gain. So the comparison with other options isn't simply 3% against whatever else: there is an exit cost. But the starting figure is 3%, not 6%.
- It works the other way too. If you bought at €40 and the stock falls to €20, with the same dividend your yield on cost is 3% and the dividend yield is 6%. There, yield on cost falls short.
- It doesn't work for comparing positions. Two stocks bought in different years have yields on cost that depend mostly on when you got in, not on which one pays more today.
Gross or net: pick one and stick to it
Is the dividend in the numerator gross or net? There is no rule here either: it is a convention, and everyone chooses. What you shouldn't do is mix them: a net yield on cost compared with a gross dividend yield will make you think your position earns less than it does.
Both choices have their logic. The yield that quote websites publish is calculated from the announced dividend, which is gross, so gross lets you compare with them. Net, on the other hand, shows you what actually reaches your account after withholding, and if what you want to know is how much your portfolio pays you, it is the more honest one. How much each country keeps is in the guide to foreign dividend withholding.
Scrip shares and reinvesting: your cost moves too
So far your average cost has been fixed. But there are two common situations in which it changes, and your yield on cost with it, without the company touching its dividend.
The first is the dividend paid in shares, like Iberdrola's scrip dividend. When you choose new shares, you receive fully paid-up bonus shares («acciones totalmente liberadas»), and Spain's personal income tax law sets their cost in article 37.1.a: the acquisition value of both the new shares and the old ones «resultará de repartir el coste total entre el número de títulos, tanto los antiguos como los liberados que correspondan» — it is the total cost spread across all the shares, old and new. The total cost doesn't change; the number of shares does.
The second is reinvesting the cash dividend by buying more shares at the market price. There you do put money in, and the total cost goes up.
Suppose you have 1,000 shares that cost you €10 each (€10,000), that they trade at €25 today and that the company pays €0.50 per share. I'm leaving withholding out so the arithmetic stays visible. That dividend comes to €500, that is, 20 new shares. If the following year the company pays €0.50 per share again, you collect €510 either way, but your yield on cost is not the same:
| Scrip shares | You reinvest the cash | |
|---|---|---|
| Shares | 1,020 | 1,020 |
| Total cost | €10,000 | €10,500 |
| Average cost | €9.80 | €10.29 |
| Next dividend (1,020 × €0.50) | €510 | €510 |
| Yield on cost | 5.10% | 4.86% |
The same shares and the same payment give two different yields on cost, because the cost is recorded differently. With scrip shares it goes up; reinvesting at prices above your cost, it goes down. It is one more reason not to read it as what your money earns: it depends as much on how the cost is booked as on what the company pays. How each route is taxed is explained in the scrip dividend guide.
How to work it out with what Tortuga shows you
Tortuga doesn't calculate your portfolio's yield on cost. What it does give you are the two pieces to work it out yourself, holding by holding:
- The cost. In your Portfolio, the Avg cost column gives you what you paid per share. If you would rather do the sum with totals, the Total cost column is one click away in the column organizer.
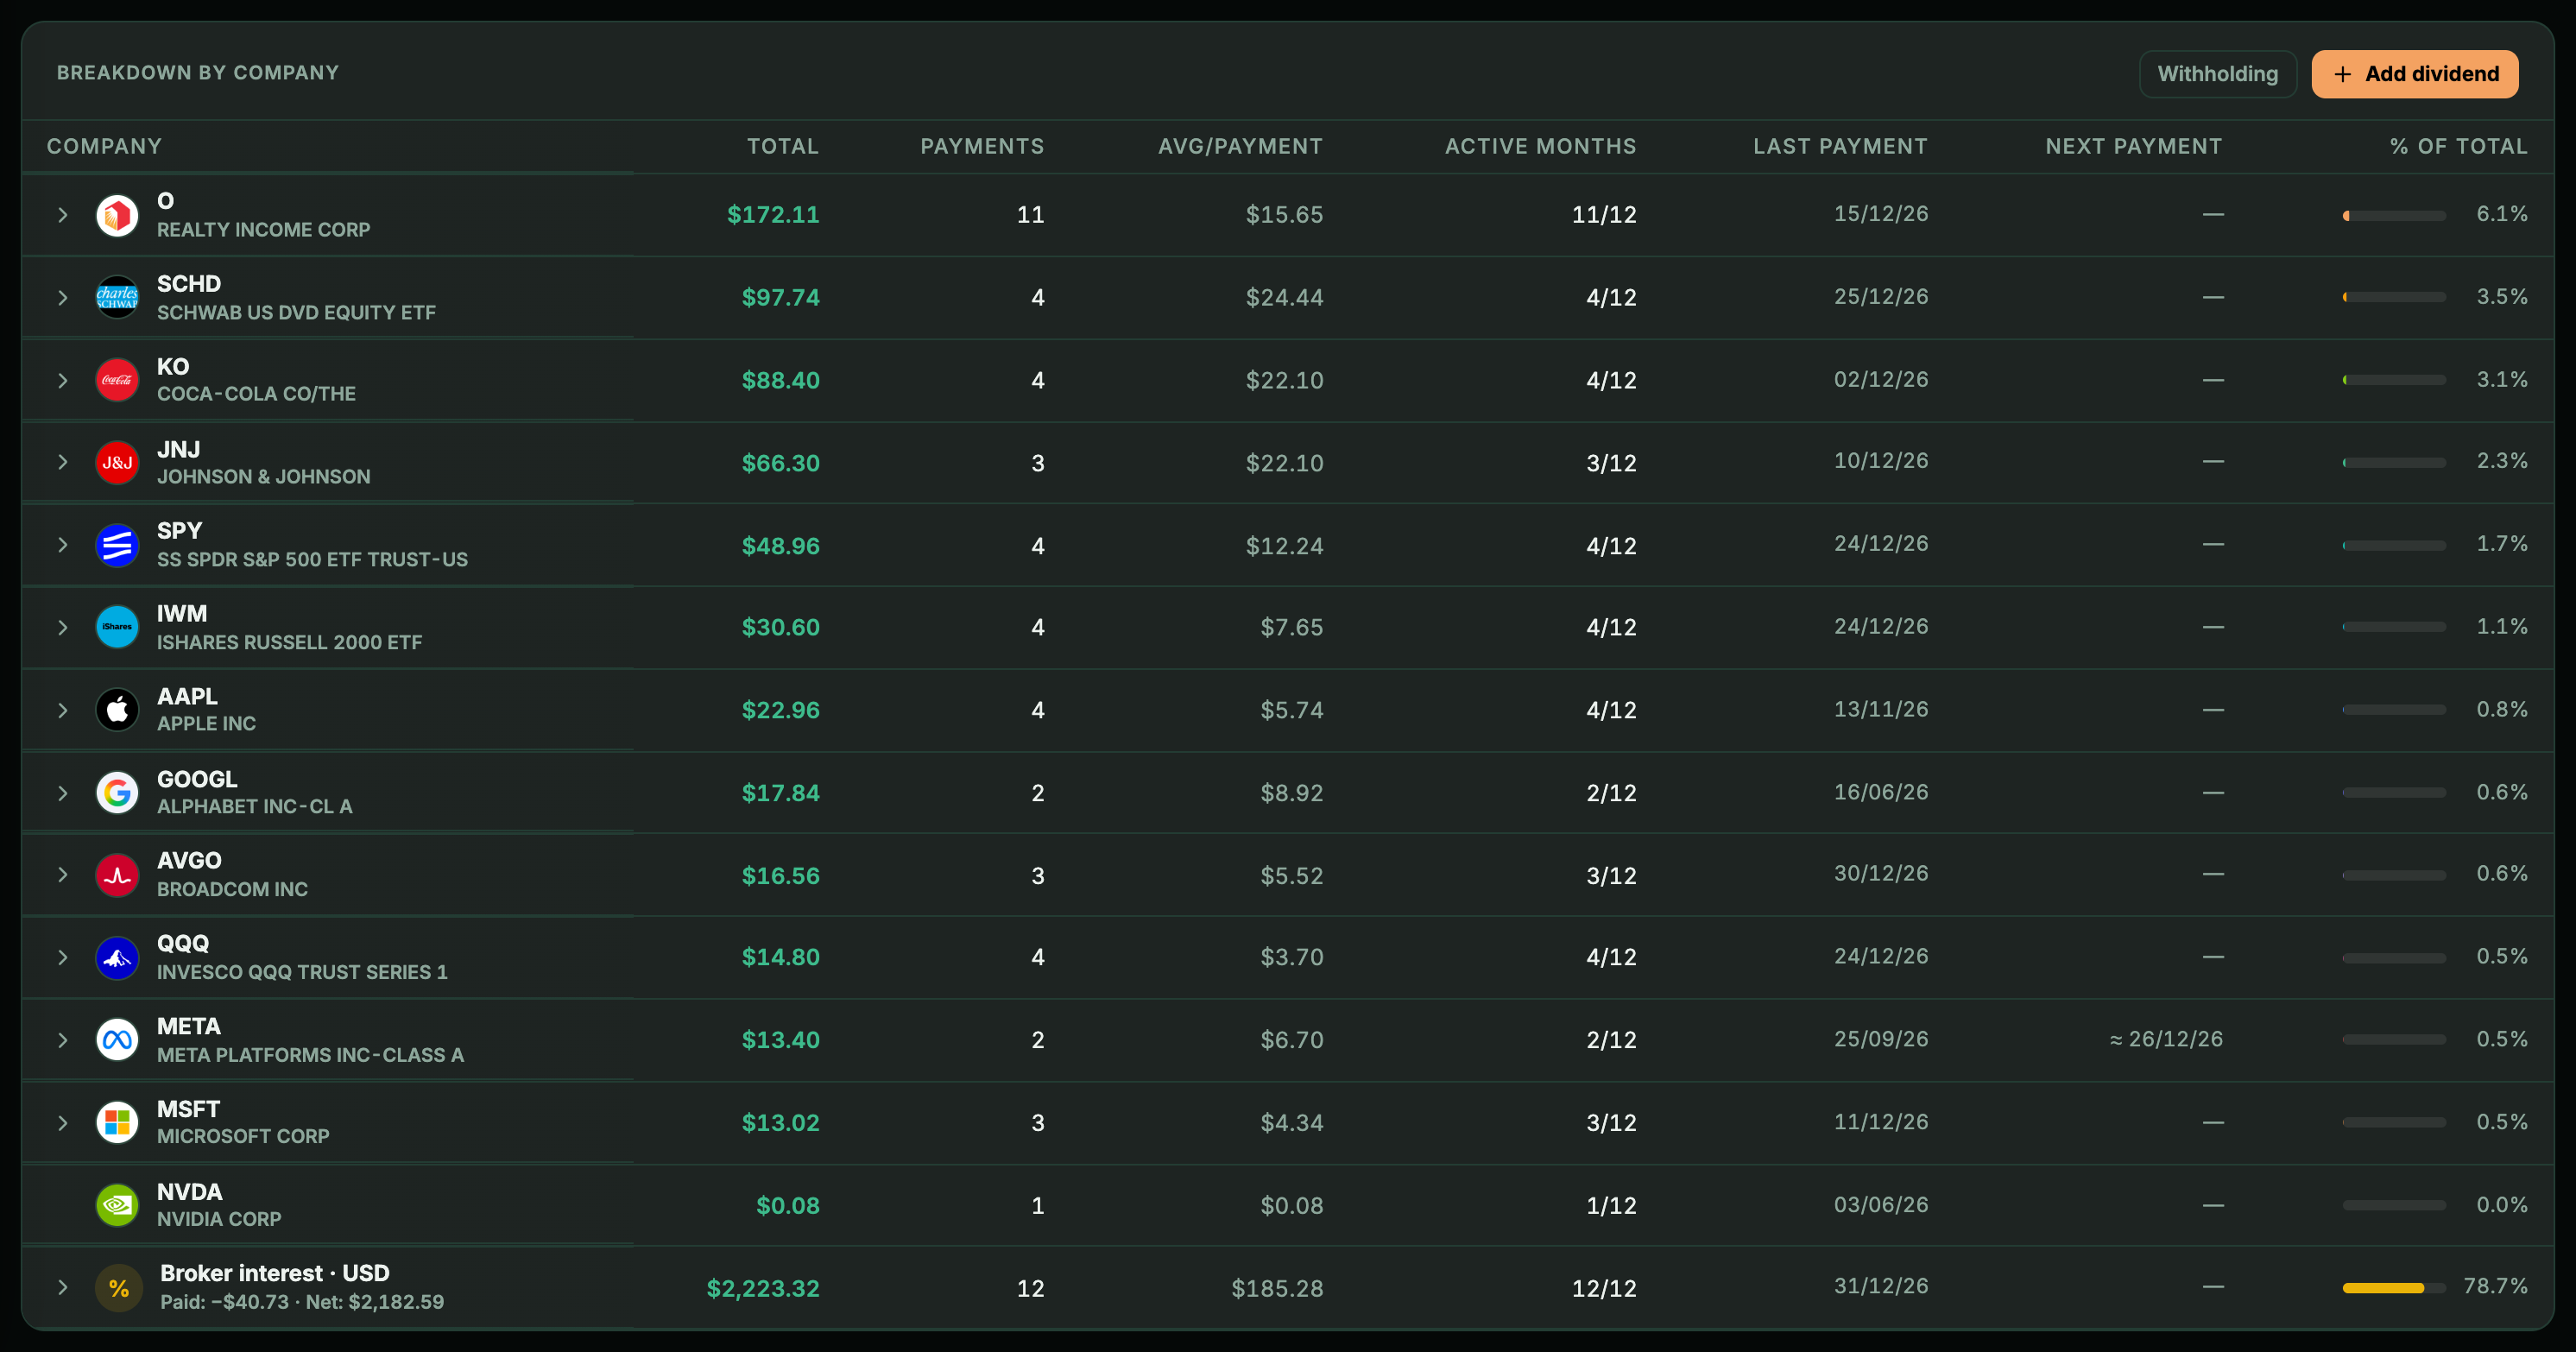
- The dividend. In Portfolio › Dividends, the Breakdown by company table gives you the «Total» each company has paid you in the year you pick, net or gross depending on the toggle. With ING or the tastytrade CSV, net and gross are the same: the file only has what you received. And if your broker provides no payout history, the table estimates it from Yahoo data and marks it «Estimated».
- The division. Year total ÷ (average cost × number of shares), or simply year total ÷ total cost. With the example above: €120 ÷ €2,000 = 6%.
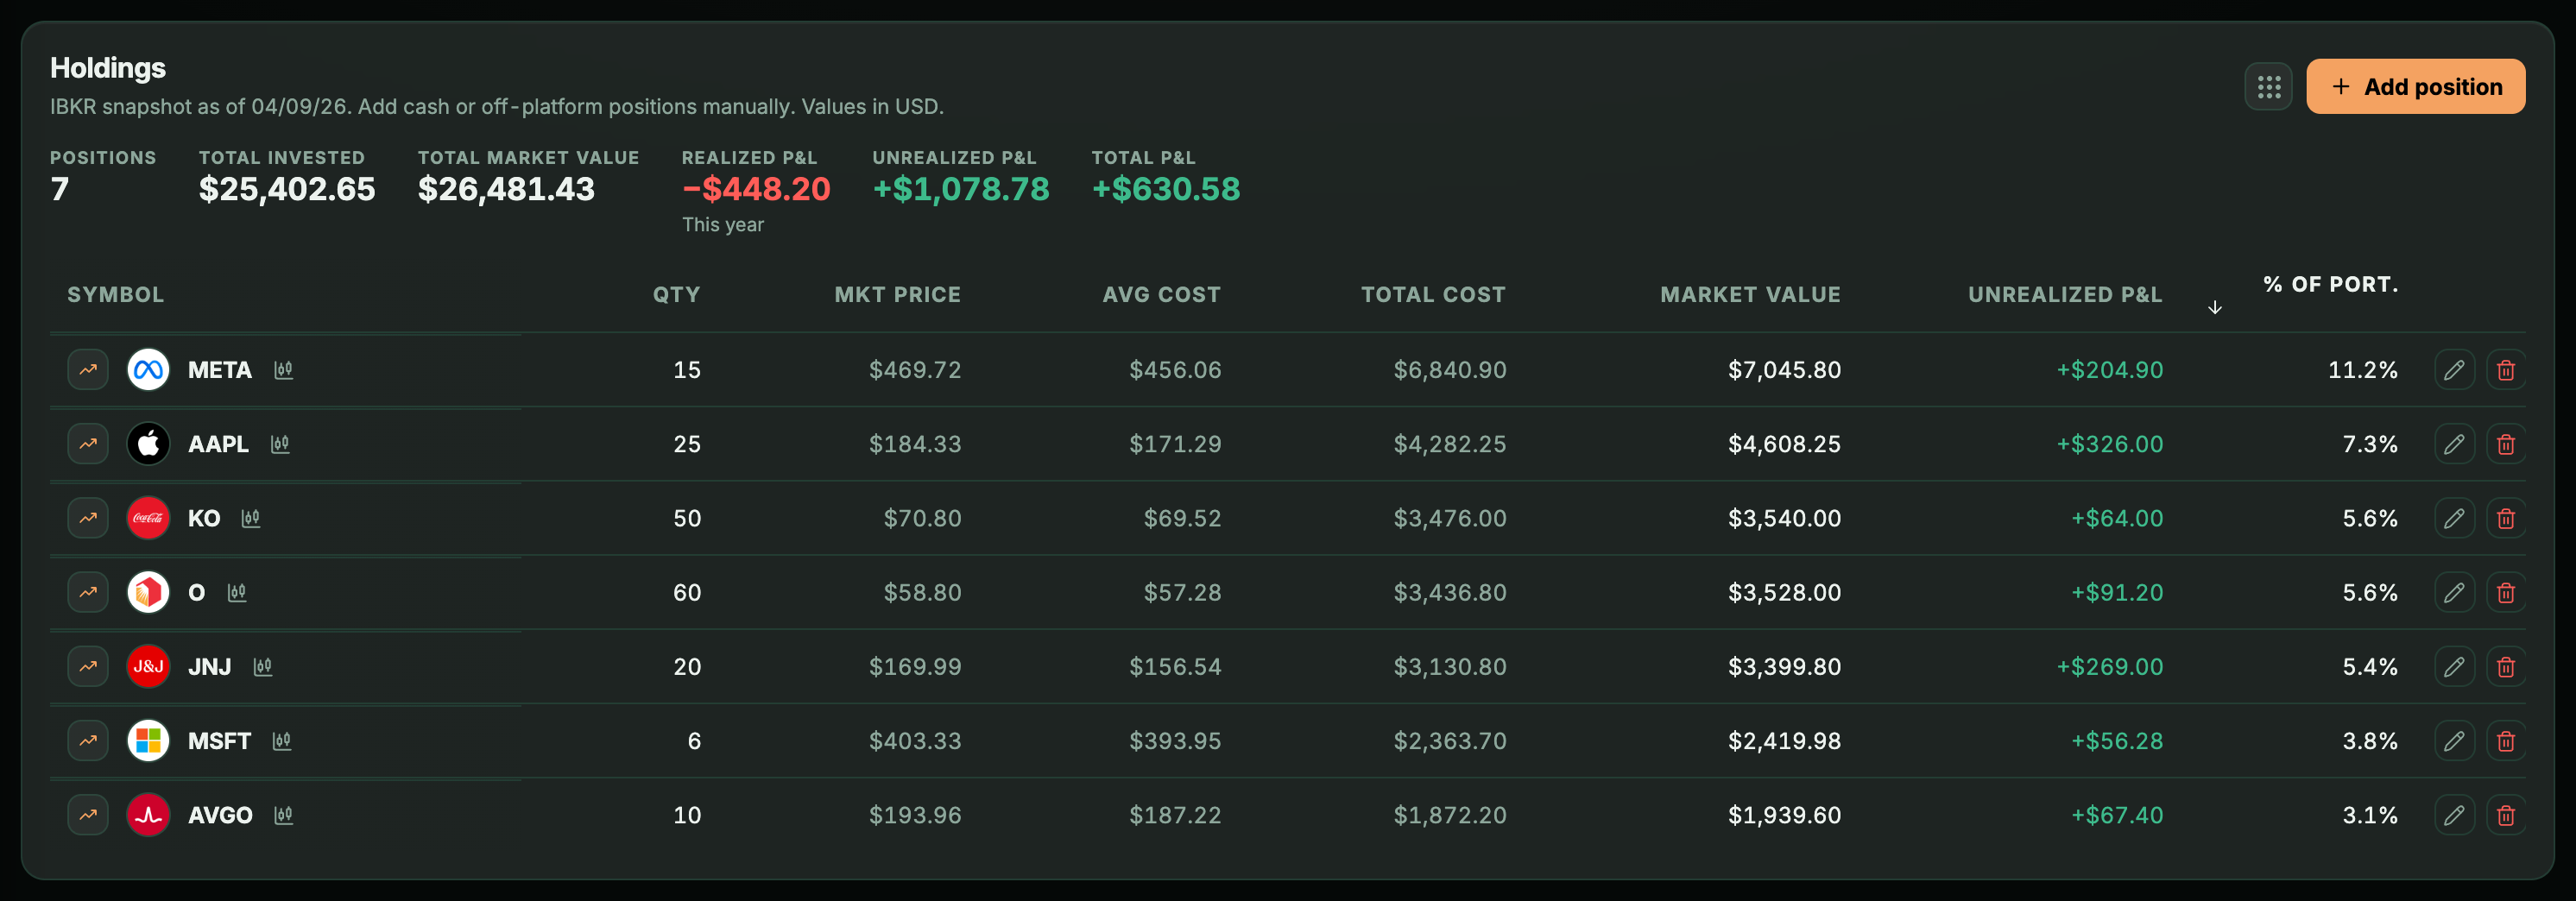
A few caveats are worth keeping in mind before you trust the result.
- Calendar year, not the last twelve months.The table goes by year. The current year is only part way through, so use the last full year or, if you want the last twelve months, expand the company's payments — each with its date and amount — and add them up yourself across two years. And if the company has raised or cut its dividend, last year's figure lags behind.
- If you changed the number of shares during the year, the total mixes periods with more and fewer shares. In that case, divide each payment by the shares you held that day to get the dividend per share, add them up and divide by your average cost.
- With DEGIRO and ING, scrip shares come in at zero cost.When Tortuga recognizes a scrip dividend (with DEGIRO, if the file includes the rights, and with ING), «Avg cost» counts those shares at zero: 1,000 shares at €10 plus 20 scrip shares give €9.80, which is the article 37.1.a split. The yield on cost you work out goes up, as in the table. With other file-based brokers they don't lower «Avg cost»: do the split yourself.
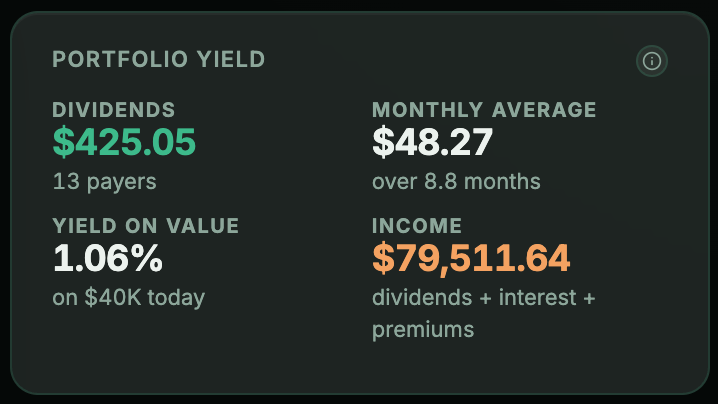
For the other view, the present one, the dashboard has «Yield on value»: the net dividends collected in the period you pick divided by the current value of your stocks, ETFs and funds. It covers your portfolio as a whole, not holding by holding, and it isn't annualised: use a full year if you want to compare it with dividend yield, and remember it is net.
Keep reading
- Iberdrola’s scrip dividend: what to do with your rights and what happens to your cost basisTwice a year Iberdrola asks what you want to do with your dividend, and if you don’t answer, it chooses for you. The three options, which number changes in your portfolio with each one, and how each is taxed.
- Foreign dividend withholding tax for Spanish residents: how much each country keeps and what you get backOut of a $100 dividend, $100 never reaches you. How much each country keeps, what you can deduct on your Spanish tax return, what you can only reclaim abroad, and where you see it on your Interactive Brokers statement.
- Dividend calendar: how to build your portfolio’s and get paid every monthThe market calendar tells you who pays this week; your portfolio’s tells you whether you will get anything in March. How to build it separating announced from estimated, and how to fill the empty months.