Guide · Dividends
Tracking your Interactive Brokers dividends: received and projected

Tortuga Trades · · 7 min
Your Interactive Brokers statement tells you, precisely, how much you have already collected in dividends: date, amount, currency, withholding. What it doesn't answer is the question you really want to ask —how much you will collect next year if you leave the portfolio alone— nor does it add up what is already coming in from two other places: interest on your cash and the premiums of the options you sell. Three numbers that almost nobody puts together.
What the statement answers, and what it doesn't
An IBKR Activity Statement is an impeccable history: every dividend payment is recorded with its date, its gross amount, its withholding and its currency. It is exactly what you need to keep track of what you have collected, and no spreadsheet improves on it.
What it doesn't do —because that isn't its job— is look ahead. The statement doesn't know which stocks you hold today or what dividend per share they pay; it only knows what happened. Knowing how much you will collect takes a different calculation, and it is the one almost nobody does by hand, because it means crossing two pieces of data that live in different places: your current positions and the annual dividend of each one.
Collected is not the same as projected
Here it is worth pinning down a distinction that is constantly overlooked:
- What you have collectedis history. It adds up the payments already received so far this year. It is useful for keeping count, but it says nothing about whether today's portfolio will keep up that pace.
- What is projected —the PADI (projected annual dividend income)— is something else: what the positions you hold todaywould pay over the next twelve months, if the portfolio and the payments stay the same. It is calculated by multiplying each position by that stock's annual dividend per share, converted to your reference currency, and adding it all up.
The difference matters because the two figures move for different reasons. If you sell half of a position, what you have collected so far doesn't change —it's already collected— but the PADI drops immediately because you no longer hold those shares. If you buy a new position halfway through the year, the PADI goes up from day one, even though you haven't yet seen a single euro from that stock on your statement.
The calendar says things the total doesn't
Adding up each position's annual dividends gives you a total, but the total hides the way the money arrives. Two portfolios with the same PADI can spread it in very different ways: one collects it in equal parts across the twelve months, the other concentrates it in two payments from a single stock in the same quarter. The second isn't worse by definition, but it is a concentration you want to know about, not discover on the day that payment doesn't arrive.
That is what looking at the payments calendar instead of the bare total is for: which months are loaded, which months are empty, and what the next paymentexpected from each position is —the date the issuer has already announced, if there is one; if not, one estimated from that stock's payment history.
Interest on cash is passive income too
There is a source of passive income that almost never makes it into the count because it doesn't look like a dividend: the interest IBKR pays on the cash you hold uninvested, in each currency you hold it in. It is money that comes in exactly like a dividend —without selling anything, without opening a new position— and it is rarely recorded anywhere because it arrives mixed in with the rest of the balance.
Annualizing it has a catch: if you only have six weeks of interest collected this year and you multiply by twelve, a month with an unusually high balance pushes the projection to a number that won't hold. That is why it is better to annualize over a minimum window —not projecting seriously with less than a month and a half of data— rather than extrapolating the first week of January to twelve months.
PAIRR: the three sources in a single figure
With the PADI and the projected interest you already have two numbers. The third is missing, and it is the one that connects this article to the options wheel: the net premium from options sold and closed, annualized the same way. Adding the three gives the PAIRR (annualized passive income): how much would come in over twelve months without selling a single additional share or opening a new position, if the portfolio, the payments and the pace of option sales stay exactly as they are today.

Why it is worth looking at them together rather than separately
Looking at dividends on one side, interest on another and premiums on a third hides the substitution effect between them. If you stop selling puts on a position and instead just hold it and collect the dividend, the PADI doesn't notice the change —it still sees the same portfolio— but the PAIRR does drop, because it has lost the premium leg. It is the only one of the three figures that truly reflects how much passive income you are generating today with all three levers at once. The detail of what to record from each options cycle so that this leg is calculated correctly is in how to keep a record of the wheel.
Which payer really carries the weight
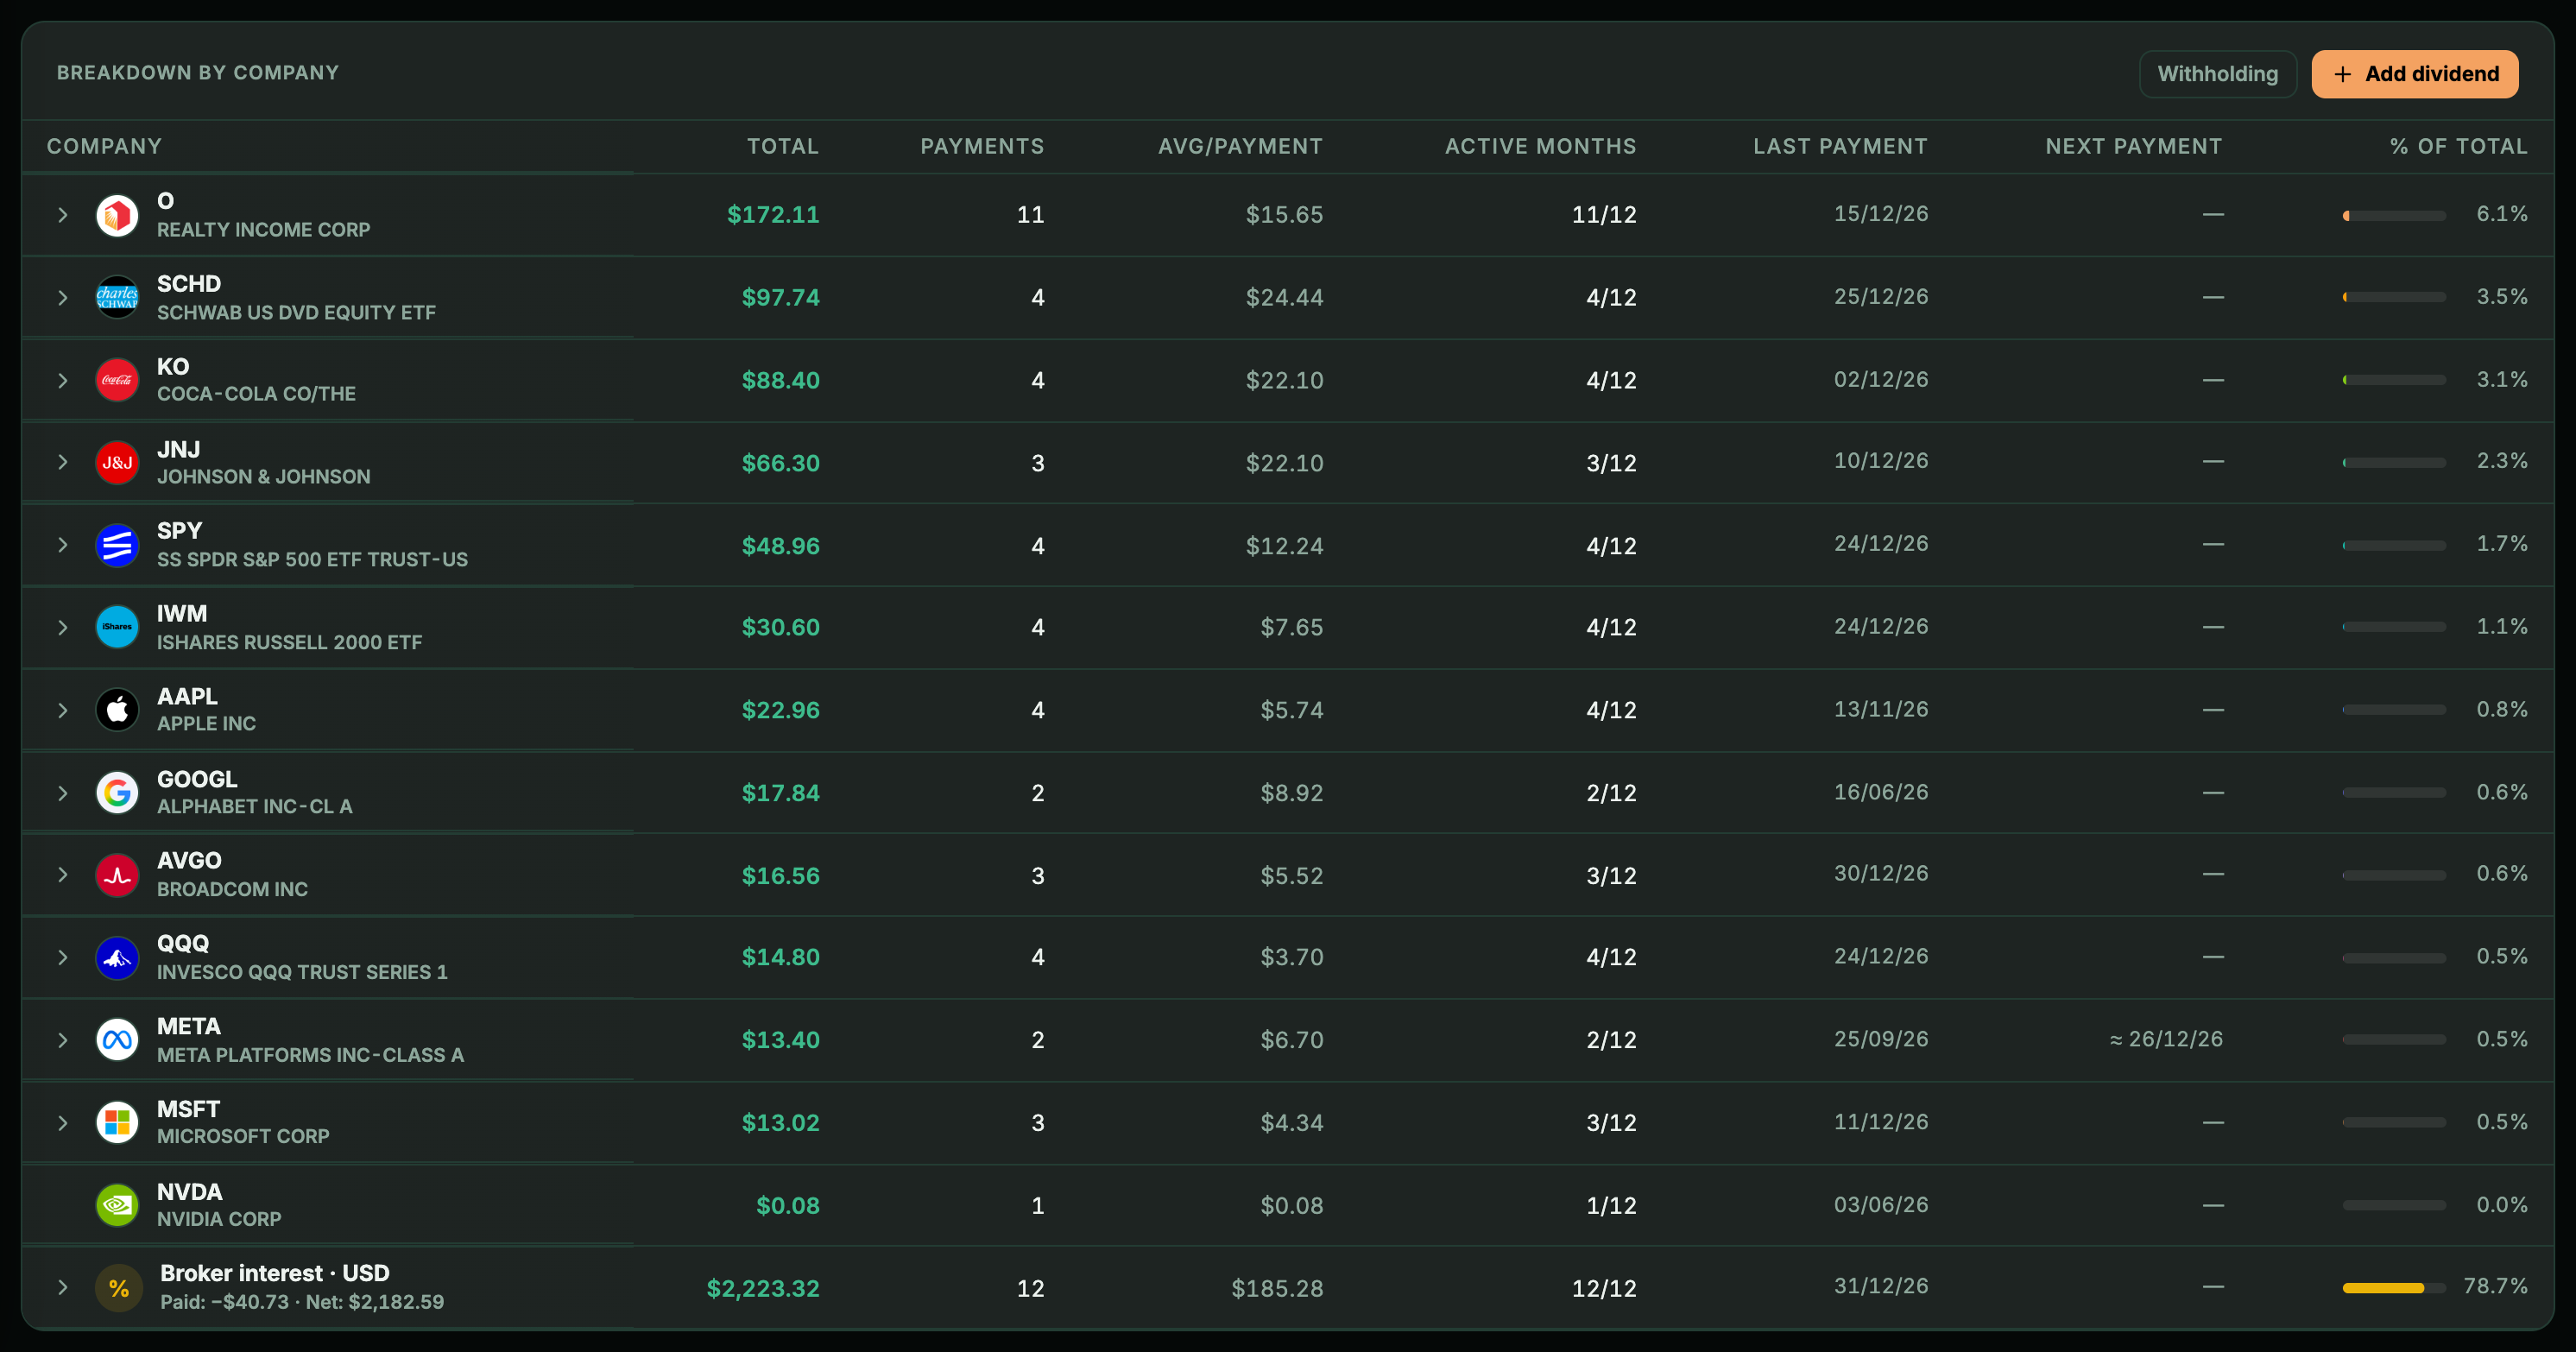
The total, once again, hides something: how much of the PADI depends on a single company. A breakdown by company answers the question the total can't answer on its own —if 40% of your projected dividend comes from a single stock, you don't have a portfolio with diversified passive income, you have a large position with a generous dividend. It isn't necessarily a mistake, but it is something worth knowing before that issuer cuts its payment and takes almost half of the projection with it.
If you don't trade with Interactive Brokers
None of this requires your broker to be IBKR. The PADI projection is calculated from your positions and each ticker's dividend per share, so a position in an account that doesn't sync automatically is also projected on its own as soon as it has been added. What you have collected is another matter: it depends on what each broker's export file contains, and they don't all contain the same thing.
- DEGIRO: dividends don't come in the «Transactions» file, but in the «Account statement» («Estado de cuenta»: Inbox → Account statement), which you upload separately. Each dividend comes in gross, with the withholding shown in that file next to it, so you can view it net or gross.
- ING Broker Naranja: the same movements file that brings the trades also brings the dividends, already net, with the withholding deducted by ING. That is how they are stored; the gross amount doesn't appear.
- Trade Republic: the transactions export includes dividends, gross and with their withholding next to them, just like DEGIRO: you can also view them net or gross.
- tastytrade: its file brings each dividend gross and the withholding, if any, as a separate negative entry. Both are imported, so the sum comes out net.
- MyInvestor: its export only covers fund orders. If any of your funds pays out, the payment is recorded by hand with «Add dividend».
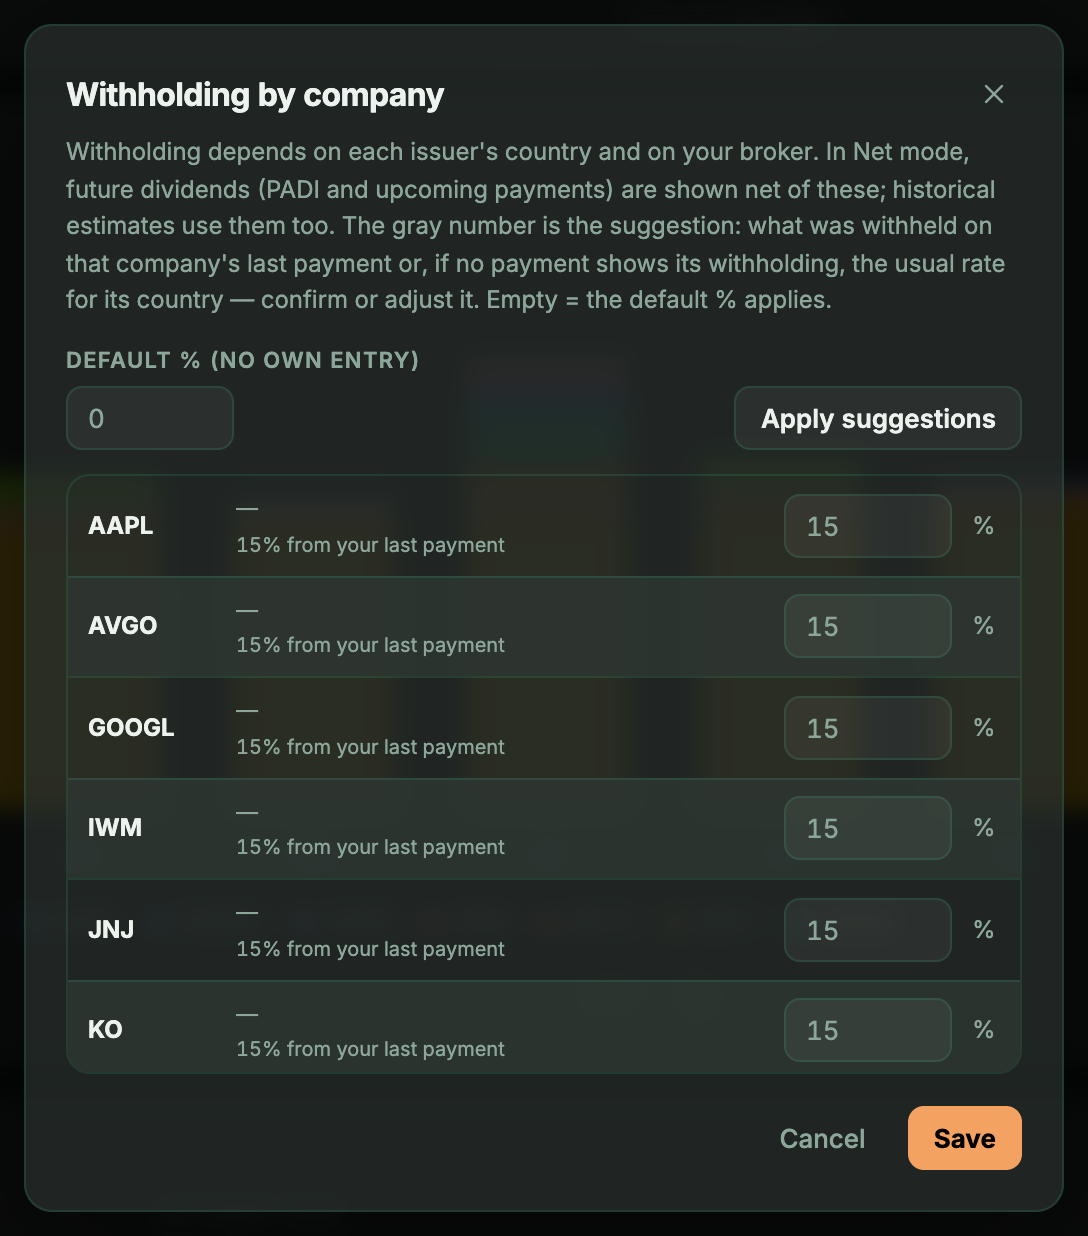
That leads to a practical consequence: with imported payments, the Net/Gross toggle in the Dividends view separates two figures with Interactive Brokers, DEGIRO and Trade Republic, which bring the withholding of each payment. With ING and tastytrade it shows the same figure in both modes: the net one, which is what their files add up to. What you can bring to net with any broker is the projected part: the «Withholding» editor, next to «Add dividend», suggests a percentage from what was withheld on each company's last payment or, if there isn't one yet, from the issuer's country, and in Net mode deducts it from the PADI and from upcoming payments. It doesn't touch imported payments.
Automating it if you trade with Interactive Brokers
With IBKR you don't need to keep uploading files: the same Flex Query that brings in your trades also brings the dividends collected with their withholding and the interest movements, so the history fills itself in, each payment can be viewed net or gross, and the PADI and the PAIRR are recalculated every time the portfolio changes. The query is created only once —it is explained in detail in how to create an Interactive Brokers Flex Query— and from then on you never have to touch it again.
It is the same connection that feeds your trades and assignments: you don't need a second query or a second token just for dividends.
Keep reading
- Dividend calendar: how to build your portfolio’s and get paid every monthThe market calendar tells you who pays this week; your portfolio’s tells you whether you will get anything in March. How to build it separating announced from estimated, and how to fill the empty months.
- Foreign dividend withholding tax for Spanish residents: how much each country keeps and what you get backOut of a $100 dividend, $100 never reaches you. How much each country keeps, what you can deduct on your Spanish tax return, what you can only reclaim abroad, and where you see it on your Interactive Brokers statement.
- How to create an Interactive Brokers Flex Query, step by stepCreate the query in Client Portal, enable the Flex Web Service token and connect your account without sharing your broker password.